
sales order processing Reports
|
Sales & Charts |
Last Revised: 01/13/14 |
With Sales & Charts, the operator can track the sales by salesperson, by branch, by warehouse, or by company totals through the graphs Dynamo creates.
1. When selecting Salesperson, you can select all of them or choose just one.
2. When selecting a Branch, a display similar to this one will appear:
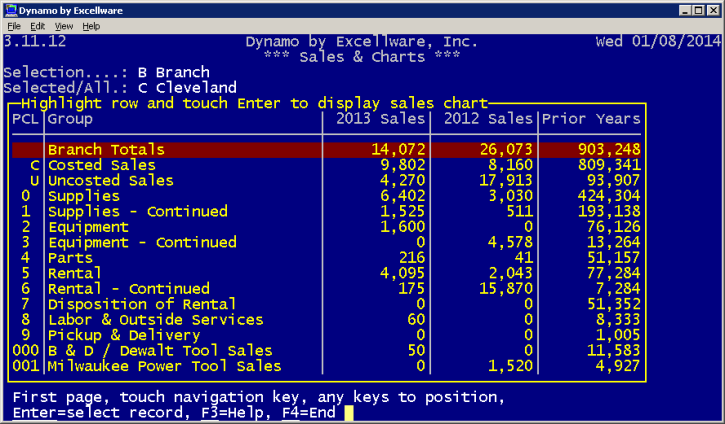
Choose any of these to be created in a graph.
3. Choosing sales charts by Warehouse will bring up a menu similar to the branch menu:
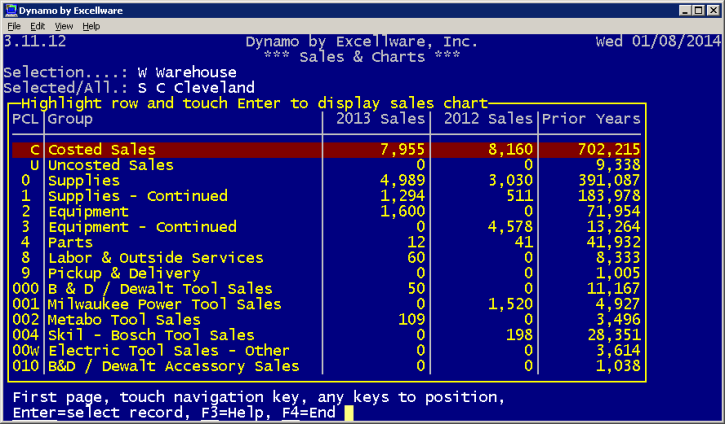
Once again, you can choose any of them and a bar graph will come up in your browser window.
4. Finally, you can choose Company Total, and another similar menu will display:

A graph will open in your browser.
Sample chart.